

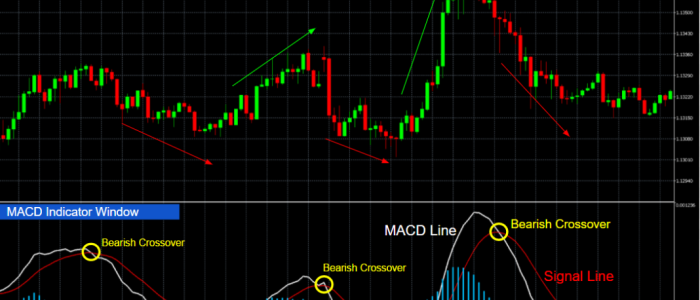
The CCI indicator was invented by Donald Lambert in 1980 to detect cyclical turns in commodities, and has since become one of the most popular momentum indicators. In essence, it measures the current price relative to an average price over a given lookback period. Unlike most indicators, the CCI uses typical price instead of closing price. Some […]
Do Bollinger Bands + Candlestick Patterns Work?
Bollinger Bands are one of the marvels of technical trading. They consist of a simple moving average surrounded by a pair of upper and lower bands. These bands are placed at a certain standard deviation multiple above and below the moving average. Bollinger Bands are typically defined by two parameters – the moving average lookback […]
Pivot Points: A Reliable Support & Resistance Indicator
As algorithmic traders, identifying support and resistance levels can be a challenge. Market structures that are easily discernable by the human eye are sometimes tedious to program. Fortunately, pivot points provide a simple mathematical definition of support and resistance levels. In this post, I’ll explain how pivot points are calculated, and how you can combine […]
Out-of-sample Testing Using Monte Carlo Simulations
Robustness is a big deal in trading strategy development. A robust strategy is insensitive to variations in price behaviour, meaning it will continue to perform well when market conditions change. To quantify a strategy’s robustness, traders often include out-of-sample tests during development. This usually involves backtesting the strategy on a different market or timeframe. But […]
What Is the Kaufman Adaptive Moving Average?
Moving averages are among the most common technical indicators in the trading world. In general, they produce reliable entry signals in trending markets, but struggle during periods of consolidation. What if we could have a moving average that adapts to the market? Kaufman to the Rescue In 1972, legendary trader Perry Kaufman started developing the […]